
Claude Design: Where Can and Should Collide

All prescriptive nonfiction titles should contain clear, professional visuals. The right charts, graphs, and tables don't just give readers' eyes a break from endless text blocks. They also prove that the authors have done their research. Think of them as credibility steroids.
My 2022 release Project Management in the Hybrid Workplace is no exception to this rule. One of many its figures compares two popular but contrasting software development methods: Waterfall and Agile.
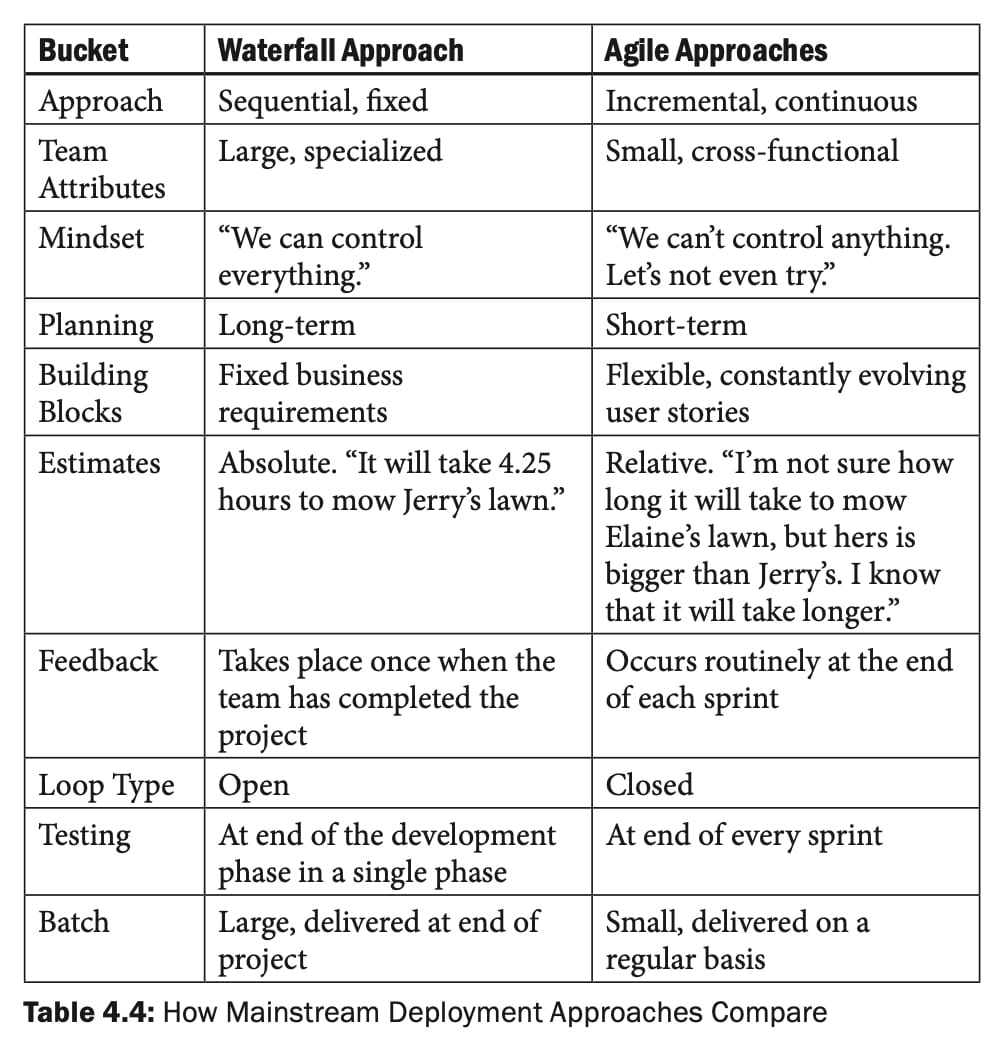
Is this representation glamorous? Hell no, but it effectively serves its purpose.
AI Experiments
On a sleepy Tuesday afternoon, I asked the revamped Claude Design to create a visually pleasing infographic based on that table using my website's palette.
Five minutes later, voilà!
Waterfall vs. Agile
Note that Claude independently added the infographic's title and its one-sentence description. No prompts necessary. Ditto for the URL in the footer, although I can't copyright it.
Pro Tip: Limit Your Use of Cool Infographics
Claude's interpretation of my table works well, but only in the right contexts. Viewing online is one of them. For two reasons, though, I would never include it if I were writing Project Management in the Hybrid Workplace today. First, there's the aforementioned copyright issue. Second, the infographic's relative complexity would make presenting it in a 5.5" x 8.5" book challenging—and those numbers exclude margins. Brass tacks: most readers would struggle to digest it.
As always, remember your audience.
What about using it during a keynote or webinar?
Hard pass—largely for the same reasons. Speakers who present dense slides and tables often lose their audiences. (Case in point: the clueless presenter in this post.) Conference attendees are doing one of the following:
- Listening to the person on stage.
- Trying to absorb the content on the slide.
- As is frequently the case, neither.
Foolish are the souls who believe audience members are concurrently reading and listening.
 Phil Simon

Simon Says
Design whatever you like using these newfangled tools, but remember your audience. Put simply:
Can ≠ Should AI doesn't change that simple heuristic one bit.






Member discussion