No API? No Problem.
Exploring a newish way that non-developers can use AI to efficiently answer complicated questions.
Schwarzenegger's Titanic Appearance and Other Hallucinations
A post on digital clones and AI's continued inability to separate fact from fiction.
AI Fails as a Seinfeld Fact-Checker
Large language models continue to hallucinate when quoting iconic TV shows.
How I Use Notion
The popular tool serves many simple purposes. Trust me, though. You're probably missing out on some less obvious ones.
Battle of the LLMs
To answer a simple basketball question, I pitted Claude and ChatGPT-5 against each other. Let's see which tool won and what we can learn from the exercise.
ChatGPT-5 Still Makes Egregious Errors
OpenAI's new model is supposed to represent an improvement over its predecessor. Maybe it is, but it's nowhere near perfect.
Why Most Niche Software Vendors Will Soon Perish
AI is making many execs at smaller companies nervous. They should be.
Professional Scribes vs. Amateur Writers
Thoughts on how these two groups approach the craft of penning a book.
In Defense of Slack
Cal Newport is a smart dude whose new book is based upon two fundamental misconceptions.
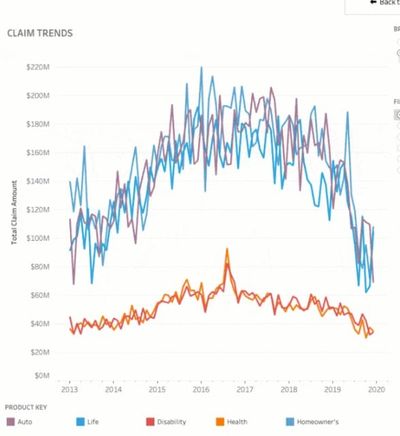
Tableau Animations Are Here. Professors Take Note.
It's a great time to spruce up a few assignments for my upcoming dataviz class.
A Visual Look at the Success of NBA Franchises
Some teams have been remarkably consistent.
Visualizing Game 7 of the 2016 NBA Finals
Geeking out with Tableau again.
Business Intelligence: The Tools Change but the Concepts Don't
Thoughts on new applications and old ideas.
Visualizing Flows
Sankey diagrams can display data in very interesting ways.
What are the odds that the Warriors go 4 of 30 again?
An in-depth look at the team's anomalous shooting performance against the Lakers.
A Visual Look at Ray Allen's Stats
Static box scores seem so 1998.