Claude and Cardio
Apple Health’s data visualizations are surprisingly basic, so I used AI to generate real insights into my workouts.
Proper Tools Optional: The AI Effect
I examine how today's chatbots have closed the gap between product experts and citizen developers while dropping an early MTV reference.
How AI Helps Me Understand My Author Royalty Statements
Thanks to today's tools, it's never been easier to derive insights from long, complicated PDFs and other unstructured data.
Why Most Niche Software Vendors Will Soon Perish
AI is making many execs at smaller companies nervous. They should be.
Does using collaboration hubs correlate with better outcomes?
A personal and decidedly unscientific analysis.
Nailing Your Book's Title and Subtitle Is Really Hard—and Essential.
Thoughts on the most important ten or so words that authors write.
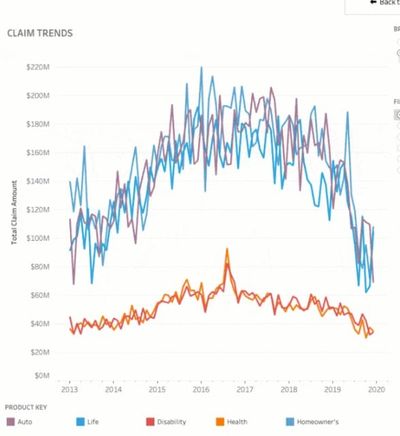
Visualizing My Students' Slack Messages
A Tableau dataviz that explores the relationship between days active and messages sent.
Professors: Expect Your Student Evaluations to Drop
The online experiment likely means lower numbers at the end of the semester.
Tableau Animations Are Here. Professors Take Note.
It's a great time to spruce up a few assignments for my upcoming dataviz class.
Visualizing Two NFL Franchises
Dysfunction and stability define Browns and the Patriots, respectively.
Advice for My Dataviz Students
Parting thoughts as they embark on their careers.
How a Good Syllabus Can Set the Right Tone With Students
Why not show them that you've got a little personality?
Visualizing My Books
An interactive Tableau dashboard on what I write about and where I write.
A Visual Look at Breaking Bad IMDB Ratings
How each episode of my favorite show stacks up.
Visualizing My Teaching Schedule
Sometimes Gantt charts actually make sense.
A Visual Look at the Success of NBA Franchises
Some teams have been remarkably consistent.
Visualizing Game 7 of the 2016 NBA Finals
Geeking out with Tableau again.