
Visualizing My Teaching Schedule

For years I've railed against Gantt charts. (It's a common refrain.) As someone who has spent more than a decade helping organizations implement massive systems, I can tell you that they don't remotely represent the timeline of launching a new ERP or CRM application. I can recall meetings during which I laughed at precise estimates a year or more out. Yep, I've seen 800-line project plans that made little sense. How do you know that testing the new system is going to take exactly 34 days?
Yet, in the right context, interactive Gantt charts can clearly display what has happened in the past. Here's an example of my teaching schedule:
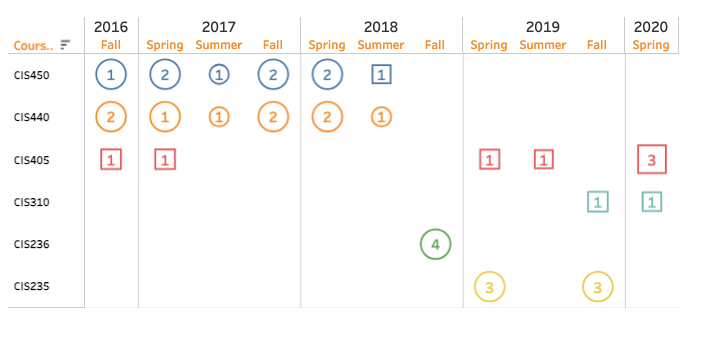
As each dataviz above illustrates, I teach very different types of courses than I did when I started at ASU three years ago. Gone are the 400-level capstone courses—at least for now. In their stead, I now largely teach survey courses designed to expose students to a wide variety of topics.
Simon Says: No one forces us to create confusing visuals.
I think of dataviz programs such as Tableau like e-mail and PowerPoint. The users—not the applications—confuse us. Adding interactivity in the form of filters helps users easily see what they want to see. They can zoom in and out as they like.


Member discussion