Becoming a Visual Organization
How can organizations use data visualization to find signals in the noise that is Big Data?
30-sec. pitch
Yeah, Big Data has arrived, but relatively few organizations are doing very much with it. This begs the natural question, Why?
OVERVIEW
 Spreadsheets, dashboards, relational databases, and even traditional business-intelligence (BI) tools of the 1990s and 2000s aren’t remotely equipped to handle today’s massive amounts and disparate types of data.
Fortunately, all hope isn’t lost.
New, robust, and, interactive data-visualization applications are helping even non-technical employees find the signal in the noise, embrace data discovery, and make better business decisions. In a word, organizations such as Netflix, eBay, and Twitter are becoming more visual.
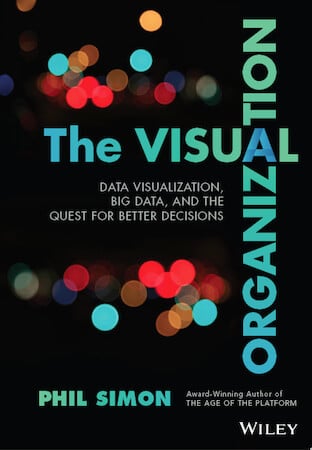
In this talk, I draw upon the lessons from my 2014 book The Visual Organization: Data Visualization, Big Data, and the Quest for Better Decisions,
To see all of my recorded talks on data visualization, click here.
OUTCOMES
What Attendees Will Learn
In this talk, I answer the following questions:
- Why is dataviz more important than ever?
- Why are static pie charts and bar graphs wholly insufficient today?
- What does Netflix know about each of its 60 million customers?
- How does that knowledge translate into better predictions?
- We’re not nearly as large as Netflix. Can a small or mid-sized organization use dataviz tools to better understand its employees, users, and customers?
- Very few—if any—of our employees are statisticians and data scientists. What type of technical sophistication
- What types of applications and technologies will help our employees actually do something with all of this data?

 PHIL SIMON