
Visualizing My Books
An interactive Tableau dashboard on what I write about and where I write.

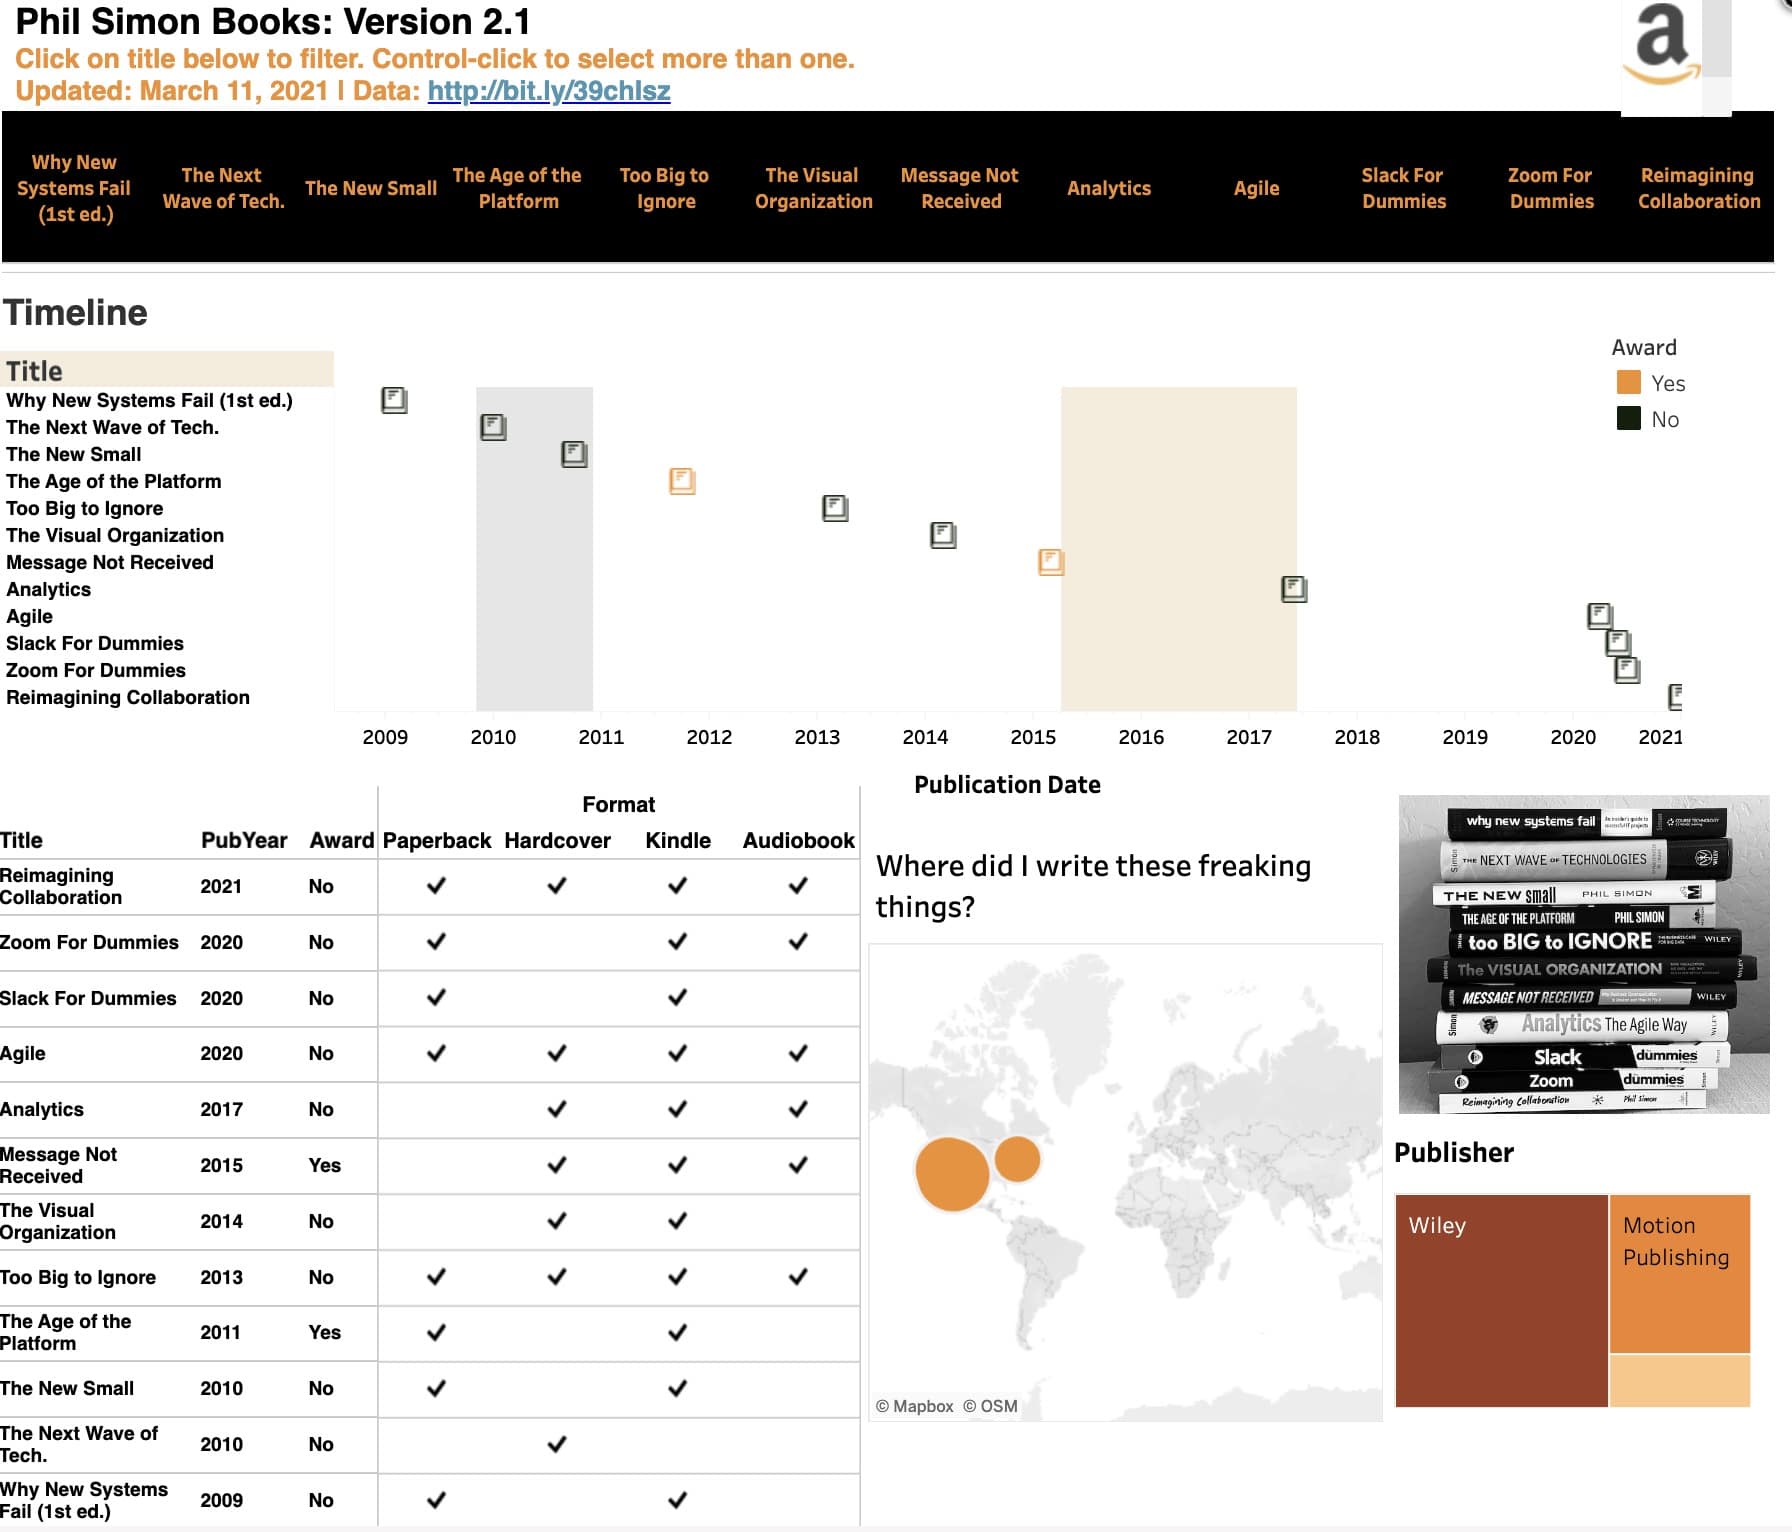
Now that I've announced the new book, I figured that it was time to update my interactive Tableau dashboard from a while back. To be sure, it's not the fanciest thing out there. I'm no dataviz deity like Ken Flerage or Ryan Sleeper. (Not bad alliteration, eh?) Few are, but I digress ...
I find it interesting to view the books from a number of different angles—something that all good dashboards allow users to do. On a different level, Tableau is freaking addictive. With the semester starting and writing taking up my spare time for the foreseeable future, I don't know if I'll be able to noodle with data visualizations for a while.


Member discussion