 PHIL SIMON
A few months ago, I wrote about the Google Refine tool to cleanse impure, duplicate, and incomplete data. I thought that it was a pretty neat tool but also that could be improved. As it turns out, others agreed. The project was recently renamed OpenRefine and ported over to GitHub, the most popular web-based hosting service for software development projects using the Git revision control system. (Read the history of the project here.)
What does OpenRefine look like now? I decided to check up on OpenRefine and see what kinds of improvements have been made.
Before continuing, let’s take a step back. You probably know that developers tend to like data and graphs, so it should be no surprise that GitHub makes the following information easily accessible on each of its projects:
- Contributions over time
- Additions and deletions over time
- Time and day of commit activity (To contribute source code on most large projects, one must make modifications and then “commit” those changes to a central repository. Many large projects have committer FAQs and bylaws. For instance, to see the Hadoop ones, click here.)
- Commit activity over the previous year
The following dashboard shows data on the most recent OpenRefine improvements:

Of course, you can drill down on any of these graphs. For instance, the punchcard in the lower right-hand corner graph begs the following question: What days and times do these improvements take place? Fortunately with GitHub, these answers aren’t terribly difficult to discern. Check out the following bubble plot:
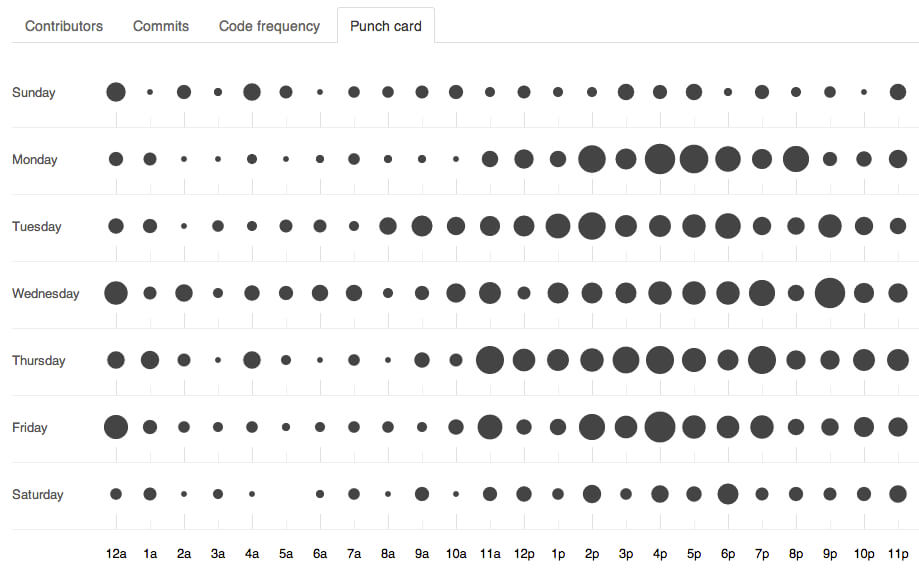
Click to embiggen.
It shouldn’t be surprising that there aren’t too many developers working on OpenRefine at 5 a.m. on a Saturday morning. I suspect that the same holds true for other open-source projects.
It’s never been more important to keep developers happy.
To be sure, there are many reasons for GitHub’s massive success. Developers love the site and tweets like this one aren’t uncommon. As Jimmy Jacobson, co-founder of social polling startup Wedgies told me, “Github built a social layer on top of an already powerful collaboration tool programmers used to build programs together. This has allowed code written by one developer to be easily shared and improved by thousands.”
I’d argue that one of the largest drivers is GitHub’s developer-friendly nature–and tools like real-time data visualizations shown above that cater to the needs of those who build tools. It’s never been more important to keep developers happy, a point made in excellent e-book The New Kingmakers.
Simon Says: Court the Developers
Every company is becoming a technology company. Some have just not realized it yet. To this end, it’s essential to attract, retain, and motivate developers. The term talent war is, if anything, an understatement. It’s a veritable bloodbath out there. Here’s visual proof:
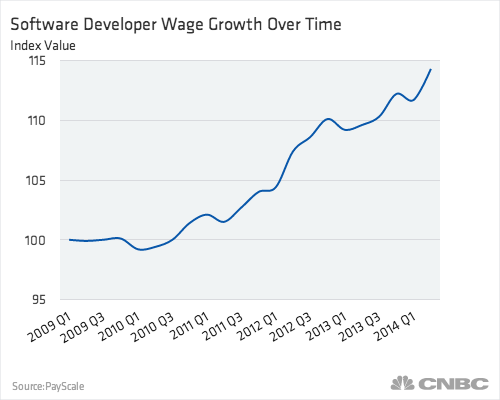
Don’t skimp when building resources for developers. Listen to their feedback–and act on it, or another organization will. Harnessing the power of Big Data and platforms almost always requires some level of developer input.


0 Comments