THE NINE WINS AXIOM AWARDS

PHIL SIMON

Award-winning author, dynamic keynote speaker, trusted advisor, & workplace tech expert 

Never Confuse Can and Should

A really bad visual serves as an important reminder.
Feb | 8 | 2016


Feb | 8 | 2016
}


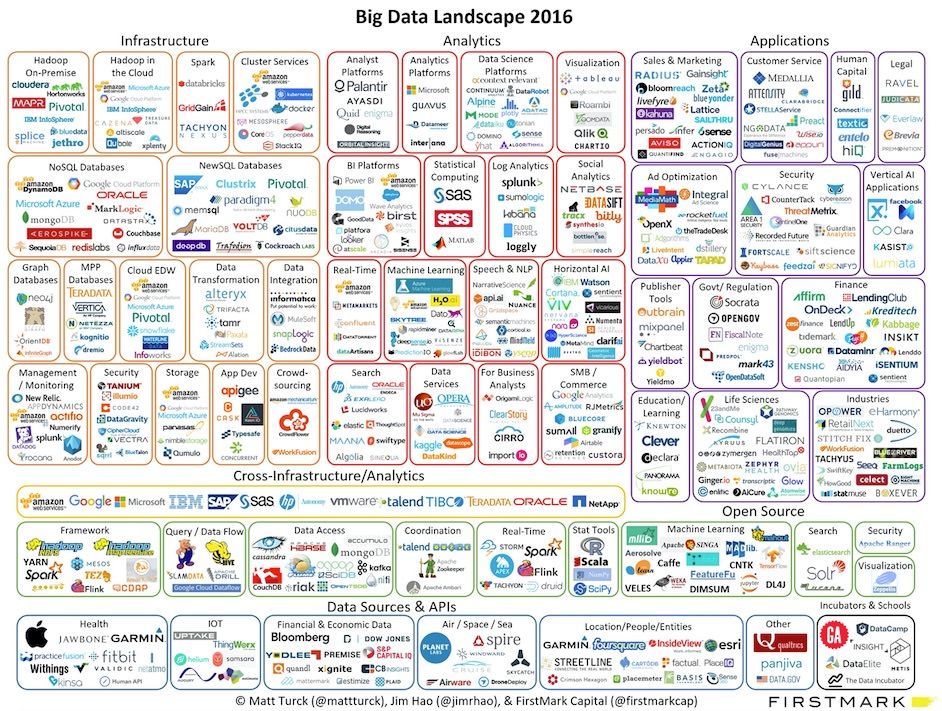
Much like language, data and data visualizations can be used to both clarify and confuse. I’m an advocate for the former, not the latter.

Unfortunately, though, some people have a tough time distinguishing can and should. Far too often, people ask the question “Can we create a graphic?” as opposed to “Should we create a graphic?”

Against that backdrop, allow me to present a truly terrible visual:

Click to embiggen.

To be fair, there’s plenty of precedent for these terrible visuals. See the Conversation Prism and this downright marketing atrocity.

Remember the definition of the word communicate: to make common.

What’s the point with the one at the top of this post? Perhaps it is to convey that the “Big-Data landscape” is vast—and that is certainly true. If the creators’ intent is to convey actual understanding, though, this visual fails miserably. Forget for a moment that we’re living in an era of increasingly smaller screens. Even with a 50-inch monitor two feet from our faces, most of us would barely be able to make out each of these logos, to say nothing of actually comprehending what they mean.

Simon Says: Just because you can doesn’t mean that you should.

Remember the definition of the word communicate: to make common. If readers can’t even see your visual, then what are the odds that true understanding takes place?

Go Deeper

Outliers

Thoughts on parallels between emerging technologies from last decade and the WFH debate.

Receive my musings, news, and rants in your inbox as soon as they publish.


 Blog E Data E Big Data E Never Confuse Can and Should

0 Comments

Comments close 180 days after post publishes.


Next & Previous Posts

0 Comments